US dairy: A peek at the market, alternative dairy and SEA
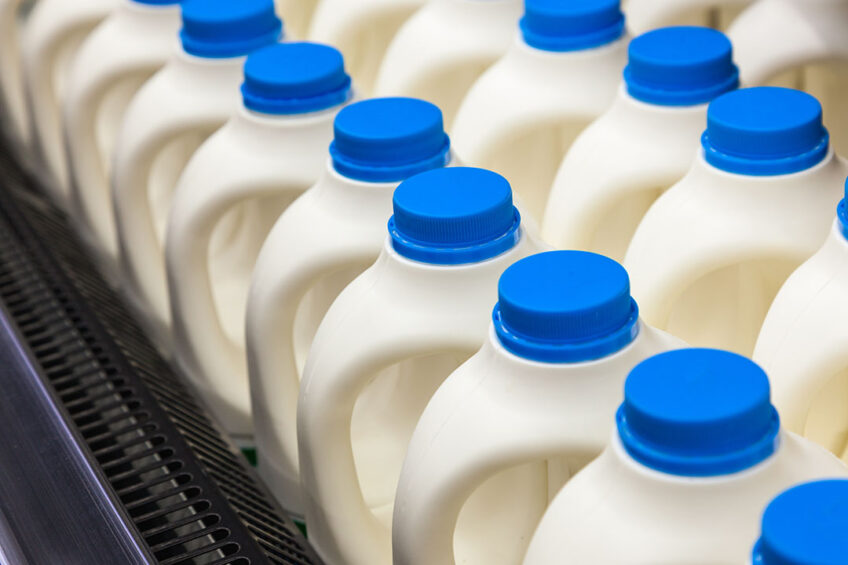
The US dairy sector can be summed up as having a stable and consistent increase in milk production. A decline in the number of dairy operations can be seen, as well as an increase in the number of cows at dairy farms.
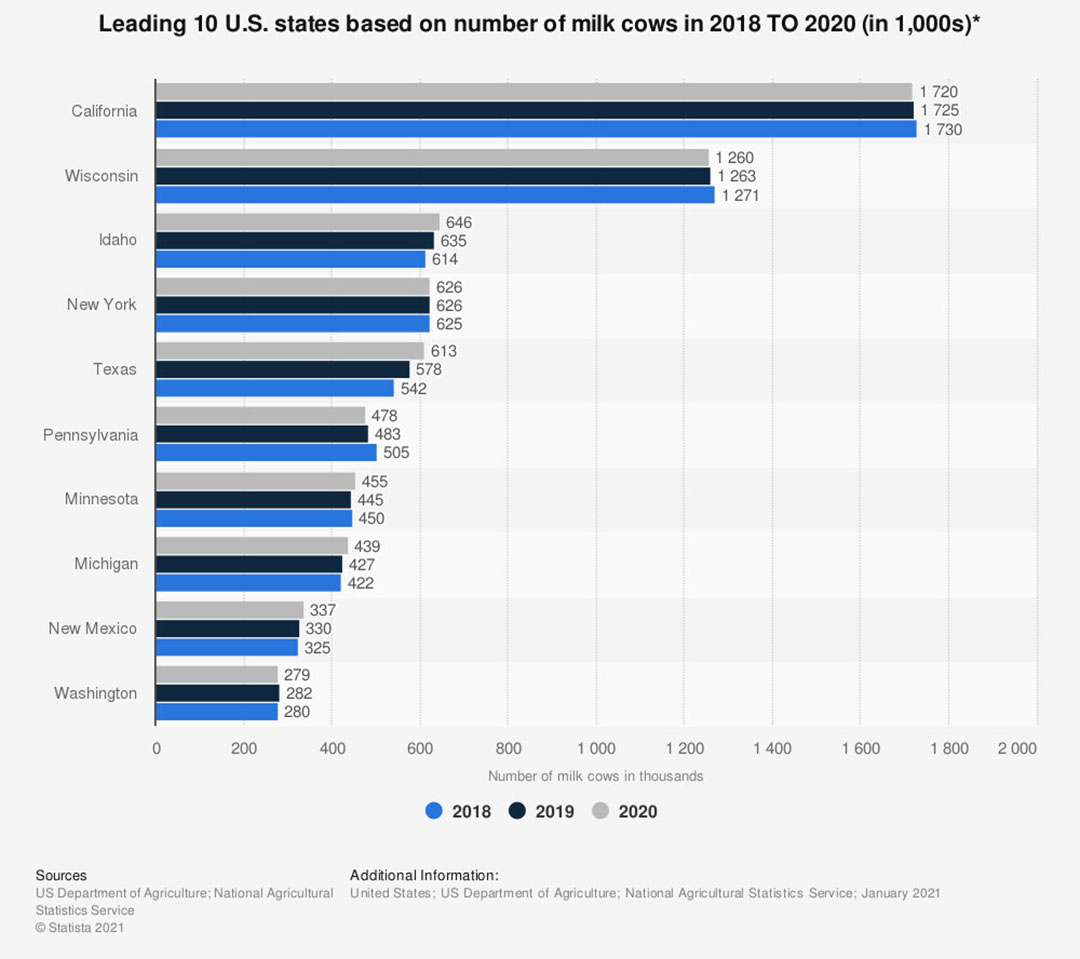
In 2019, the major milk-producing states were California, Wisconsin, Idaho, New York, and Texas, which in total produced more than 50% of US milk supply, according to the USDA. Cheese is on a growth path in the US, as demand has been increasing, spurred on by the availability of a wider variety of cheeses. This scenario has also meant that commercial exports of US dairy have grown over the years since the 2000s.
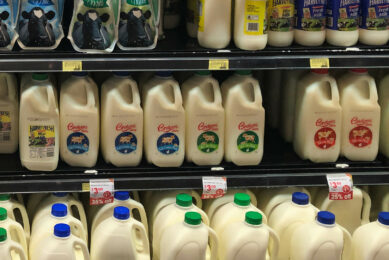
The consumption of dairy products int he US has risen faster than the growth in population. However, use of individual products has shown great variation. Total US per capita consumption of fluid milk has declined because of competition from other beverages.
Alternative milk
The rise in the availability of plant-based milk such as almond, cashew, pea, soy, and rice, among others, can be seen globally. In the US and according to the USDA’s Economic Research Service (ERS), Americans have been drinking less and less fluid cow’s milk on a per person basis since the mid-1940s. However, the rate of decline has recently increased. Between 1995 and 2009, ERS data shows that the per-person US supply of cow’s milk available for consumption fell at an average annual rate of 1%. From 2010 to 2017, per capita availability fell at an average rate of almost 2.5% a year. This is according to a report published late last year. It added that plant-based alternatives have impacted consumption statistics as mentioned here.
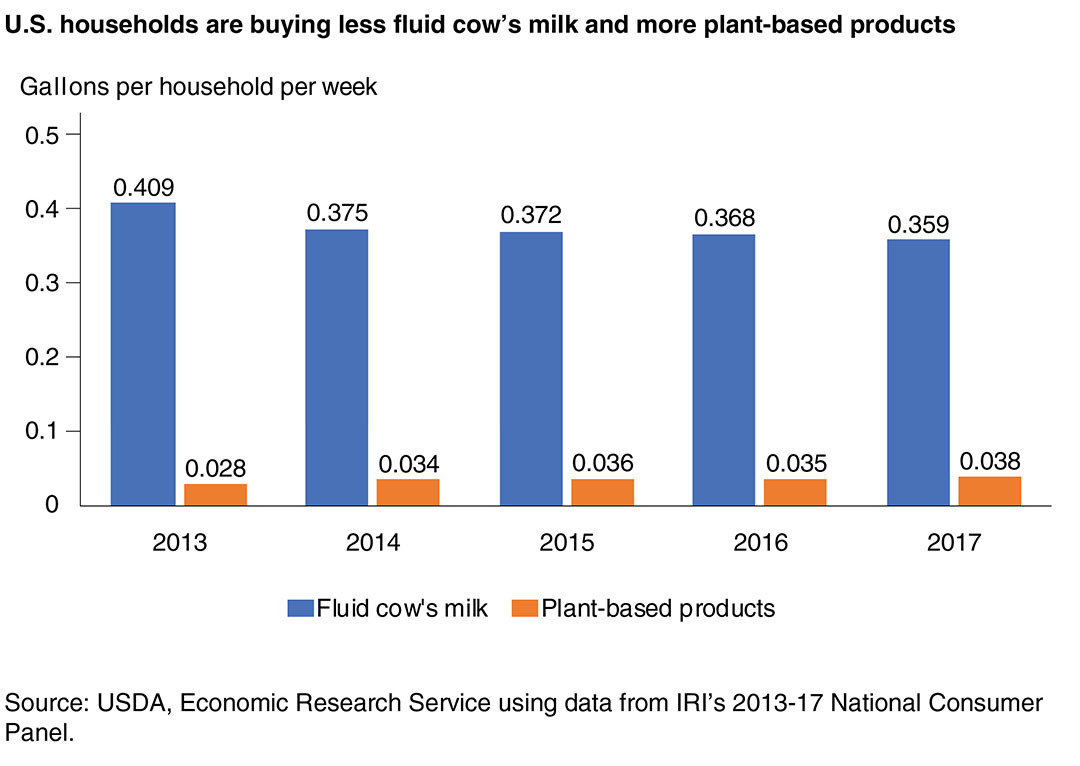
Despite its impact, cow’s milk remains important in the market. It found that during 2017, for example, 92% of American households bought cow’s milk. Even among those who bought plant-based alternatives, 90% still bought cow’s milk. However, sales of cow’s milk fell over time, while sales of plant-based options increased, the report stated.
A look at southeast Asia
With major economic changes, urbanisation and developments and changes in consumption appearing in southeast Asia (SEA), the demand for dairy products in the region will boom in the coming decades, says the USDA. To get a picture:
• SEA total dairy imports have grown in recent years, from US$3.8 billion in 2006 (valued in constant 2018 US dollars) to US$6.3 billion in 2018.
• SEA dairy imports from the US grew from US$401 million in 2006 (valued in constant 2018 US dollars) to US$738 million in 2018. Over this period, the US moved from the fourth to the third-largest SEA dairy product supplier, behind New Zealand and the EU.
• Cheese has been the dairy product most consistently imported by SEA countries from most trading partners.
• The EU has been the chief competitor for the US in the SEA dairy market.
2022 and trade
• On 1 January 2020, the US-Japan trade agreement went into effect. Japan committed to providing substantial market access for the US by phasing out most tariffs, enacting meaningful tariff reductions, or allowing a specific quantity of imports at a lower duty.
• On 15 January 2020, the US and China signed a trade agreement whereby China agreed to increase imports of agricultural products and make some changes to several non-tariff trade issues.
• The US-Mexico-Canada (USMCA) agreement entered into force on 1 July 2020. Major dairy-related provisions and developments of the agreement were included.
For 2022, the average number of milk cows is expected to continue declining in the first half of 2022. Higher exports are expected for dry skim milk products, whey products, cheese, and butterfat products.
This article is a summary of reports by the USDA.


